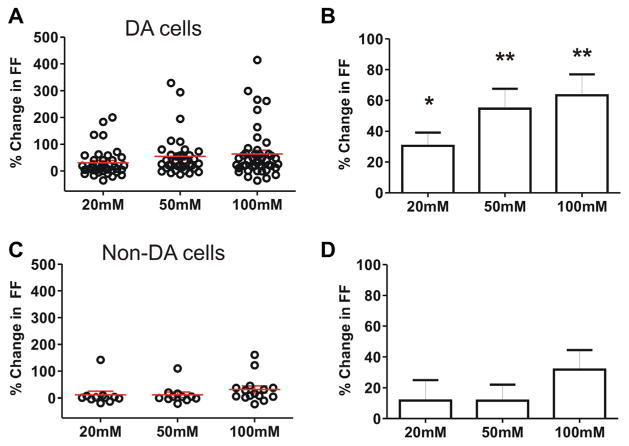
Fig. 5.
Population data for responses of all VTA neurons to acute EtOH VTA DA and non-DA cells were tested for EtOH responses at three concentrations (20, 50, and 100 mM). (A, B) For TH-positive DA cells, the mean increase in FF was 31% at 20 mM (n=38, p<0.05), 55% at 50 mM (n=35, p<0.01), and 64% at 100 mM (n=46, p<0.01). (C, D) TH-negative neurons had a mean increase in FF of 12% at 20 mM (n=11), 12% at 50 mM (n=11), and 32% at 100 mM (n=15).

