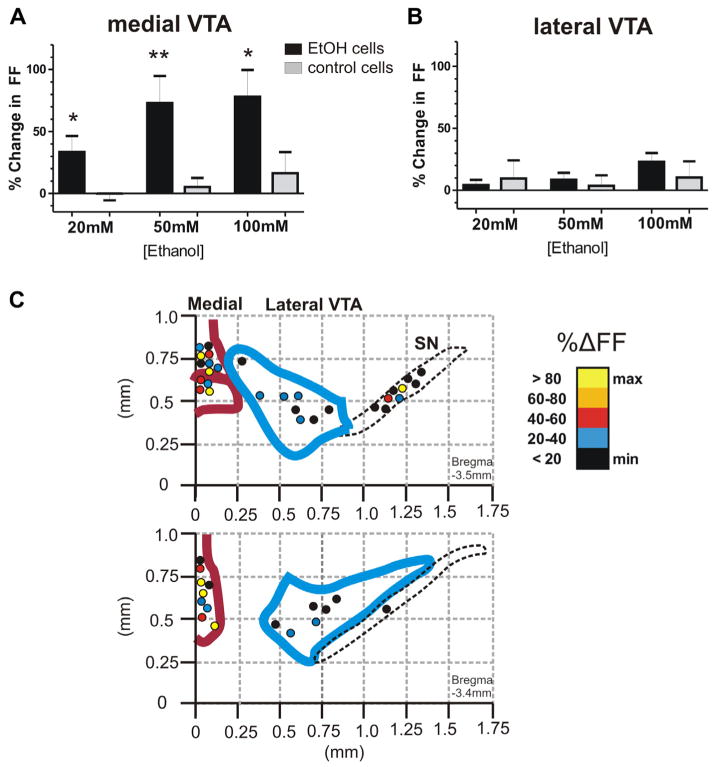
Fig. 6.
Medial and lateral VTA DA cells differ in sensitivity to ethanol. Medial VTA and lateral VTA DA cells were tested for responses to three doses of EtOH. (A) For medial VTA, the mean increase in FF with EtOH (black bars) was 34 ± 13% at 20 mM, 73 ± 22% at 50 mM, and 78 ± 22% at 100 mM (n=19). These changes were significant (p<0.05 at 20 and 100 mM, p<0.01 at 50 mM EtOH) as compared to medial VTA control neurons without EtOH (gray bars) at corresponding time points during the recording. (B) In the lateral VTA, the mean increase in FF with EtOH was 4 ± 4% at 20 mM, 8 ± 6% at 50 mM, and 23 ± 7% at 100 mM (n=11). These changes were not significant compared to lateral VTA control neurons without EtOH (gray bars). (C) Map of recording locations from TH+DA cells in the VTA and SN. Top: A caudal slice (posterior to bregma −3.5 mm). Bottom: A more rostral slice (at bregma −3.4 mm). Color scale represents the% change in FF with EtOH (50 mM).

