Figure 2.
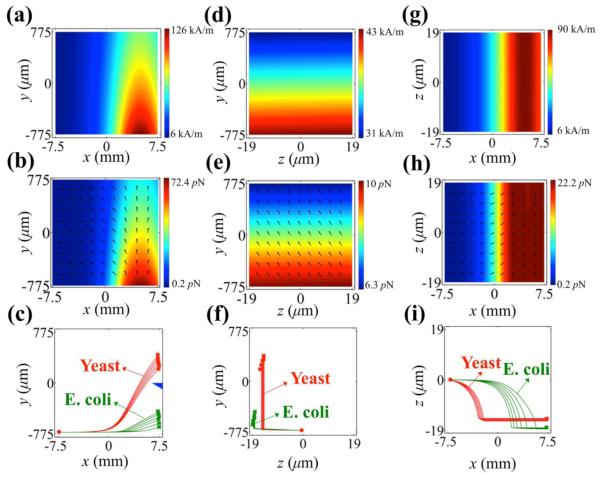
Analytical three-dimensional simulation of magnetic field and force distributions in microfluidic channel, and trajectories of cells. Simulation parameters match exact experimental conditions. (a)-(c) x-y plane (z = 0), (d)-(f) y-z plane (x = 0), (g)-(i) x-z plane (y = 0) of magnetic field strength (surface plot) (a, d, g), magnetic force (surface plot: force magnitude; arrow plot: force direction) (b, e, h), and particles’ trajectories (c, f, i). Dots indicate starting points, while crosses indicate ending points of cells’ trajectories. E.coli cell has volume range of 2.1 – 16.7 μm3 and Yeast cell has volume range of 180 – 382 μm3, resulting in a distribution of trajectories for each type of cell. Blue triangle in (c) indicates boundary between Outlets C and D.

