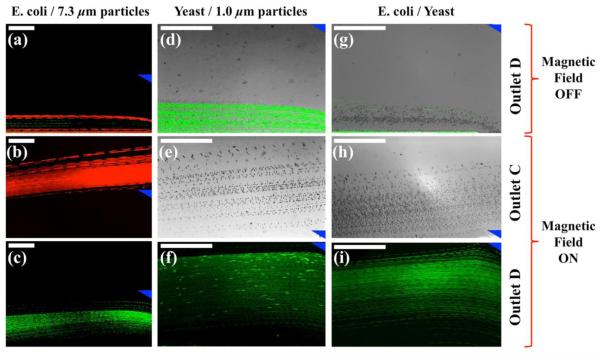
Figure 4.
Experimental composite micrographs of sorting process. (a), (d), (g) were particles/cells mixture ((a): Escherichia coli (green) and 7.3 μm particles (red); (d): Saccharomyces cerevisiae (red and bright-field) and 1.0 μm particles (green); (g): Escherichia coli (green) and Saccharomyces cerevisiae (red and bright-field) before magnetic fields were applied. (b), (e), (h) were micrographs of Outlet C after magnetic fields were applied, and (c), (f), (i) were micrographs of Outlet D. Blue triangles indicate boundary between Outlets C and D. Scale bars represent 200 μm.

