Figure 5.
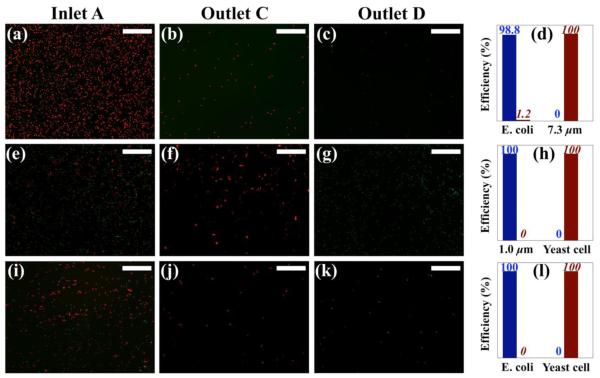
Experimental composite micrographs of size distribution analysis, including micrographs of particles/cells mixture collected before sorting at Inlet A and after separation at Outlets C and D, and remaining and separation efficiencies. (a) – (d) were for Escherichia coli and 7.3 μm particles mixture; (e) – (h) were for Saccharomyces cerevisiae and 1.0 μm particles mixture; (i) – (l) were for Escherichia coli and Saccharomyces cerevisiae mixture. Blue bar with normal number on top shows remaining efficiency, while red bar with italic number on top shows separation efficiency. Scale bars represent 200 μm.

