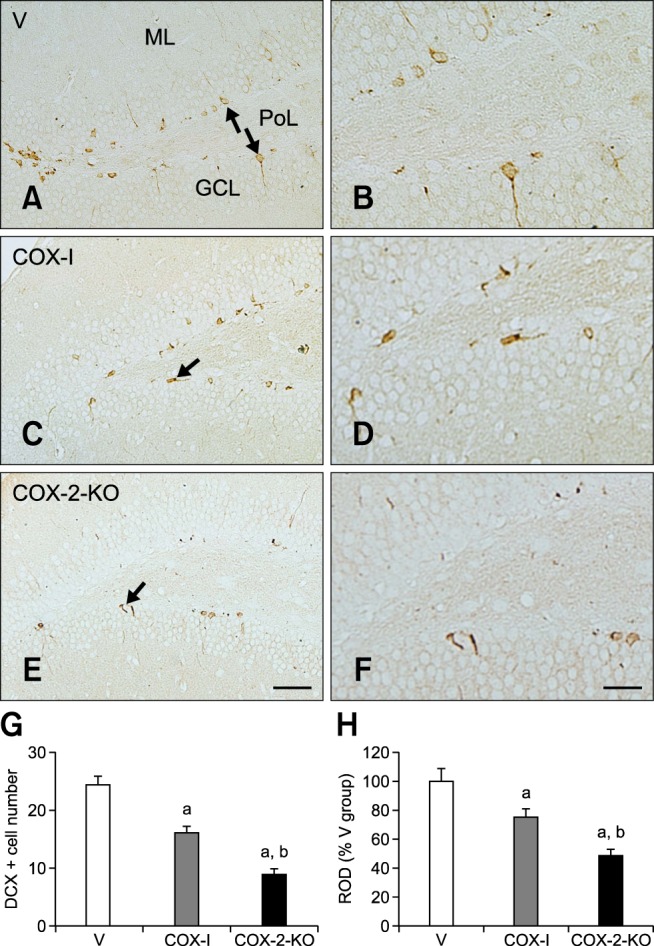
Fig. 5. Immunohistochemical staining for DCX in the dentate gyrus of the V (A and B), COX-I (C and D), and COX-2-KO (E and F) groups. DCX-immunoreactive neuroblasts were detected in the subgranular zone (arrows) of the dentate gyrus. Note that the number of cell bodies and dendrites of DCX-positive neuroblasts were prominently decreased in the COX-2-KO group compared to the V and COX-I groups. (G and H) The mean number of DCX-immunoreactive neuroblasts per section (G) and ROD expressed as a percentage of DCX immunoreactivity per section (H) in the dentate gyrus of the V, COX-I, and COX-2-KO groups relative to the V group (n = 5 per group; ap < 0.05, indicating a significant difference compared to the V group; bp < 0.05, a significant difference relative to the COX-I group). All data are presented as the mean ± SEM. Scale bars = 50 µm (A, C, and E) or 25 µm (B, D, and F).