. 2015 Sep 21;16(3):297–306. doi: 10.4142/jvs.2015.16.3.297

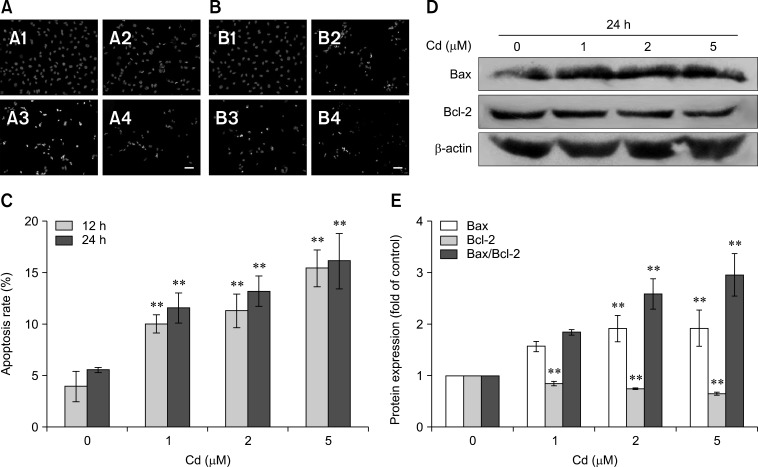
Fig. 2. Cd triggers apoptosis in OBs. (A and B) Cell nuclei as observed under fluorescence microscopy. Cells were exposed to 0 (A1 and B1), 1 (A2 and B2), 2 (A3 and B3), and 5 (A4 and B4) µM Cd for 12 h (A) and 24 h (B). Scale bars = 20 µm (A and B). (C) Flow cytometric analysis of cells showed an increased apoptotic rate in a dose-dependent manner. (D) The expression levels of Bax and Bcl-2 were assessed by western blot analysis, while β-actin was probed as a protein loading control. (E) Densitometry analysis of Bax, Bcl-2 and the Bax/Bcl-2 ratio. All data were expressed as the mean and SDs (n = 3). **p < 0.01 compared with the control group.

Fig. 2