. 2015 Sep 21;16(3):357–365. doi: 10.4142/jvs.2015.16.3.357

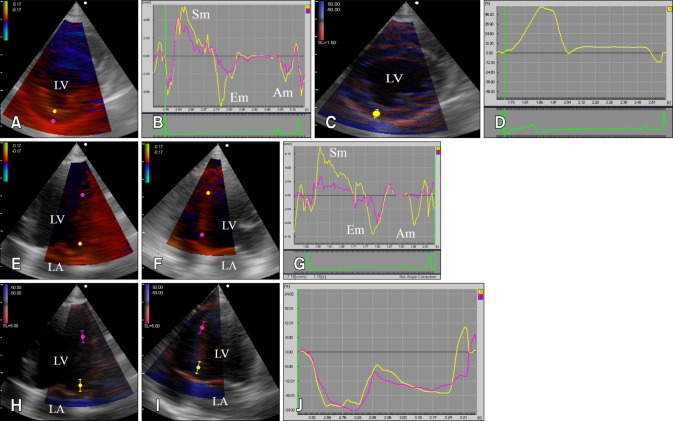
Fig. 1. Examples of radial velocity and strain (A-D) assessment on right parasternal short-axis view at the level of papillary muscles and longitudinal velocity and strain assessment (E-H) of left ventricle (LV) on left apical four chamber view in a healthy beagle dog. (A and B) For radial velocity, 2 × 2 mm samples were placed on the endocardial (yellow circle) and epicardial (pink circle) segments between the papillary muscles. Peak velocities in systole (Sm), early diastole (Em) and late diastole (Am) were measured in the endocardium (yellow curve) and epicardium (pink curve). (C and D) Strain and strain rate variables were determined for a 3.5 × 3.5 mm region of interest and 1.5 mm strain length on the same frame. Maximum positive systolic strain was obtained in the end-systole. (E-G) The basal (yellow circle) and apical (pink circle) segments of the left ventricular free wall and interventricular septum with a 2 × 2 mm region of interest were used in the velocity analyses. (H-J) Peak velocities in systole (Sm), early diastole (Em) and late diastole (Am) were measured. Using the same region of interest with 5 mm strain length, strain and systolic strain rate were determined on the same frame. Negative systolic strain reflects longitudinal compression.

Fig. 1