Fig. 3.
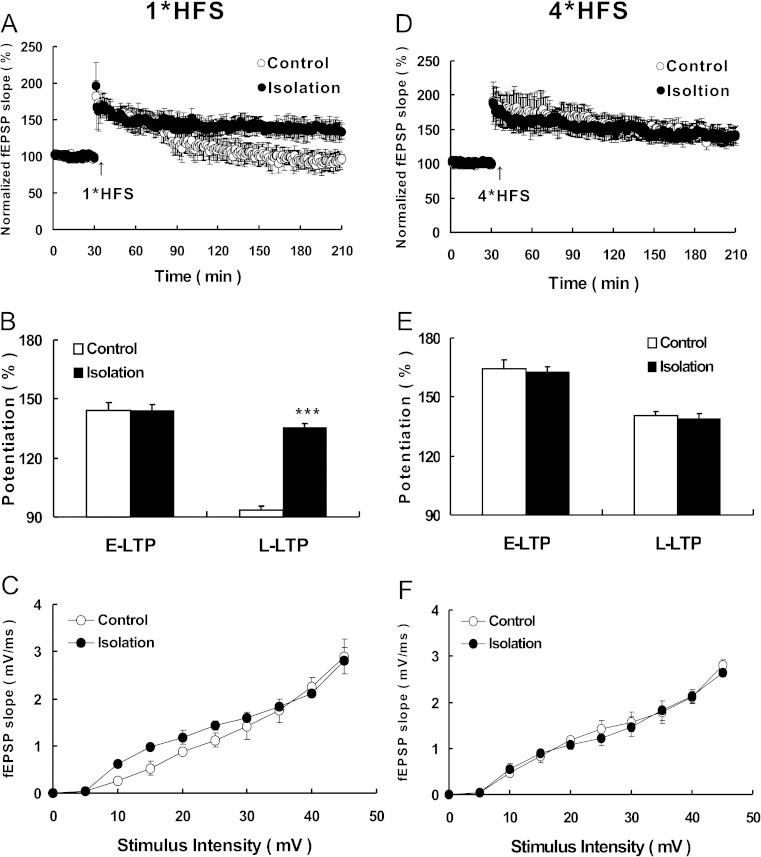
Social isolation during adolescence facilitates the induction of L-LTP. a, d Normalized fEPSP slope is plotted from control slices (open circles) and isolated slices (closed circles). Arrow indicates 1*HFS (100 Hz, 1 s) tetanus stimulation in A and 4*HFS (100 Hz, 1 s with 10-s interval) in d. b, e Histogram showing average percentage of potentiation after tetanus versus baseline (100 %) at control and isolated mice. Left showed the comparing between the E-LTP (40–50 min after tetanus versus baseline) of the two groups; right showed the comparing between the L-LTP (170–180 min after tetanus vs baseline). c, f Adolescence social isolation does not shift I-O curve. Input/output curve of fEPSP (mV/ms) versus stimulation intensity (mV) were taken from control and isolated mice. Vertical bars represent the mean ± SEM. Asterisks indicate significant differences from the relevant controls (***p < 0.001, two-tailed)

