Figure 5.

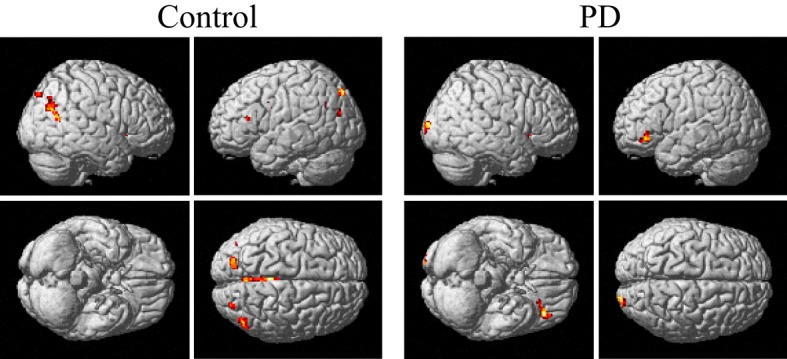
PPIs corresponding to putamen in control and PD groups (SPM8, ANOVA, P < 0.001, uncorrected, extent threshold k > 10). PD, Parkinson's disease.

PPIs corresponding to putamen in control and PD groups (SPM8, ANOVA, P < 0.001, uncorrected, extent threshold k > 10). PD, Parkinson's disease.