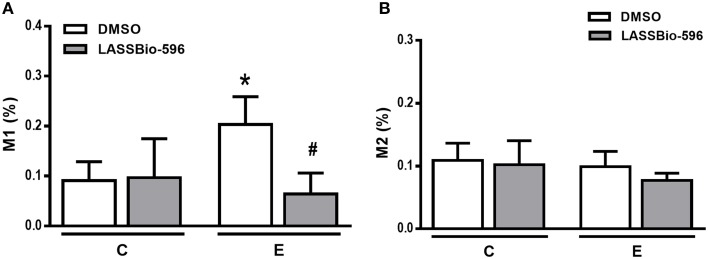
Figure 5.
Immunohistochemical analysis for the M1 (A) and (B) M2 macrophage phenotypes in lung tissue. Values are means (± SD) of six animals in each group. C-DMSO: mice received intratracheal saline and were treated with DMSO. C-LASSBio-596 mice received intratracheal saline and were treated with LASSBio-596. E-DMSO: mice received intratracheal porcine pancreatic elastase and were treated with DMSO. E-LASSBio-596: mice received intratracheal porcine pancreatic elastase and were treated with LASSBio-596. *Significantly different from respective group C (p < 0.05). #Significantly different from E-DMSO (p < 0.05).

