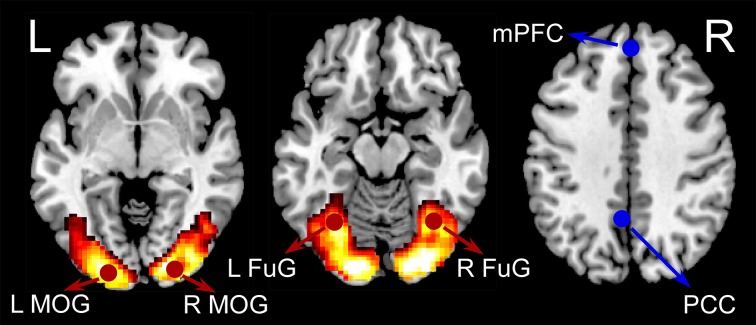
Figure 1.
The group-level BOLD activation map for visual checkerboard stimuli (hot color coded). Six ROIs used in the current analyses were displayed in red (activated) or blue (inactivated). The four activated ROIs were left middle occipital gyrus (LMOG) [MNI coordinates: right middle occipital gyrus (RMOG) (24, −91, 1), left fusiform gyrus (LFuG) (−33, −61, −14), and right fusiform gyrus (RFuG) (36, −58, −11). The two inactivated ROIs were medial prefrontal cortex (mPFC) (0, 51, 32) and posterior cingulate cortex (PCC) (−5, −49, 40)].

