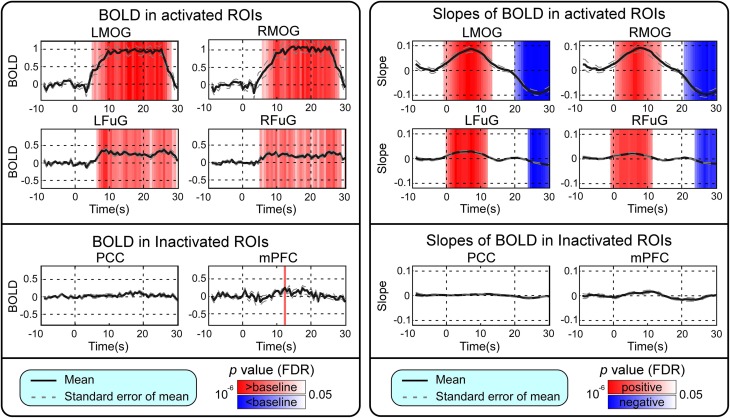
Figure 2.
Left: Mean and standard error of mean (SEM) of BOLD responses in four activated ROIs and two inactivated ROIs. Two-tailed t-test was used to examine whether the BOLD after stimulus onset was larger or smaller than baseline at each time point. The time points with significantly larger or smaller (p < 0.05, FDR corrected) BOLD responses than baseline were highlighted with red or blue background, respectively. Right: Mean and SEM of slopes of BOLD in four activated ROIs and two inactivated ROIs. Two-tailed t-test was used to examine whether the slope of BOLD was larger than 0 or smaller than 0 at each time point. The time points with significantly positive or negative (p < 0.05, FDR corrected) slope values were highlighted with red or blue background, respectively. Stimulation period was from 0 to 20 s. Results were averaged across three blocks and all subjects.

