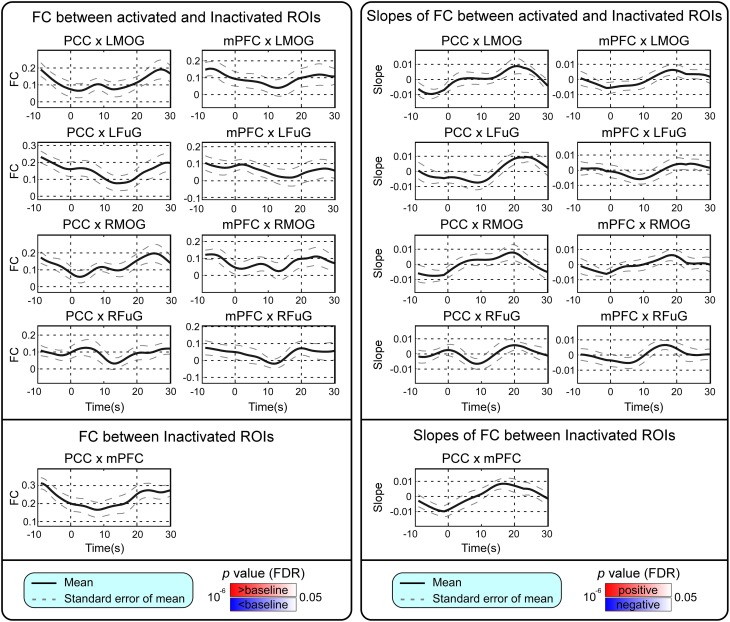
Figure 4.
Left: Mean and standard error of mean (SEM) of FCs between the activated ROIs and inactivated ROIs, and FC between inactivated ROIs. Two-tailed t-test was used to examine whether the FC after stimulus onset was larger or smaller than that in baseline at each time point. The time points with significantly larger or smaller (p < 0.05, FDR corrected) FC than that in baseline were highlighted with red or blue background, respectively. Right: Mean and SEM of slopes of FCs between activated ROIs and inactivated ROIs, and slope of FC between inactivated ROIs. Two-tailed t-test was used to examine whether the slope of FC was larger than 0 or smaller than 0 at each time point. The time points with significantly positive or negative (p < 0.05, FDR corrected) slope values were highlighted with red or blue background, respectively. Stimulation period was from 0 to 20 s. Results were averaged across three blocks and all subjects.

