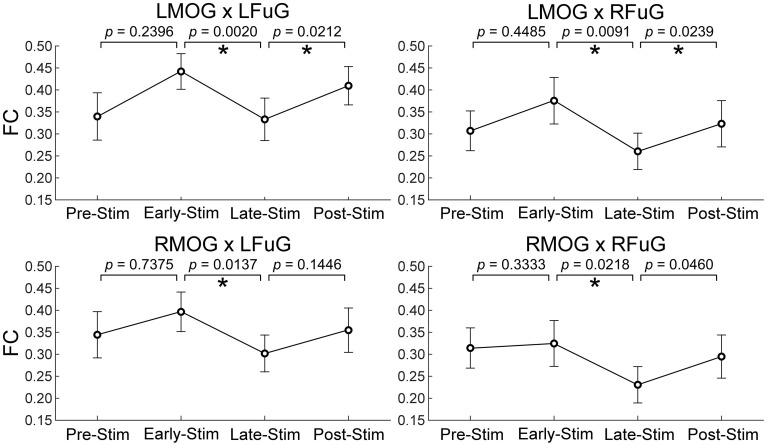
Figure 5.
Mean and standard error of mean (SEM) of FCs between higher and lower visual ROIs within four experimental sub-periods (the pre-stimulation period, PRE-STIM, −10 to 0 s; the early period of stimulation, EARLY-STIM, 0 to 10 s; the late period of stimulation, LATE-STIM, 10 to 20 s; the post-stimulation period, POST-STIM, 20 to 30 s.) Here “0 s” denoted the onset time of one visual presentation block. The p-values of FC difference between adjacent sub-periods were presented, and significant difference (p < 0.05, FDR corrected) between FCs within adjacent sub-periods was marked using asterisks.

