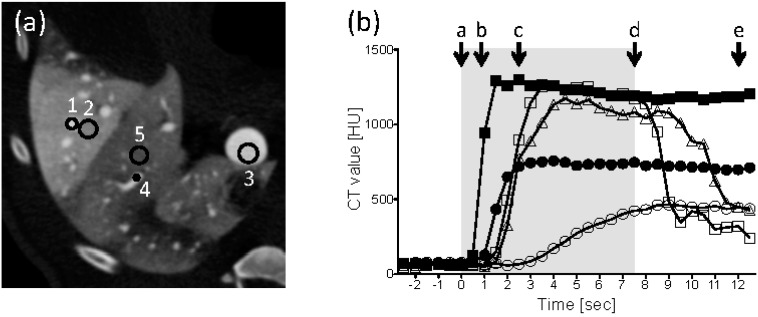
Figure 3.
Tissue intensity during a regional hydrodynamic injection. (a) The image from Figure 2d is shown with a different window width and center to represent the vessels. The regions of interest that were used to measure the CT values were the HV (target), liver parenchyma (target), the main trunk of the PV, a peripheral PV branch (non-target), and liver parenchyma (non-target), which were marked 1 to 5, respectively. (b) Time intensity curves. A period of the injection is indicated by a gray box. The time points corresponding to the Figure 2a–e are represented by a–e. Closed squares: HV (target); closed circles: parenchyma (target); open squares: main trunk of the PV; open triangles: peripheral PV (non-target); open circles: parenchyma (non-target).

