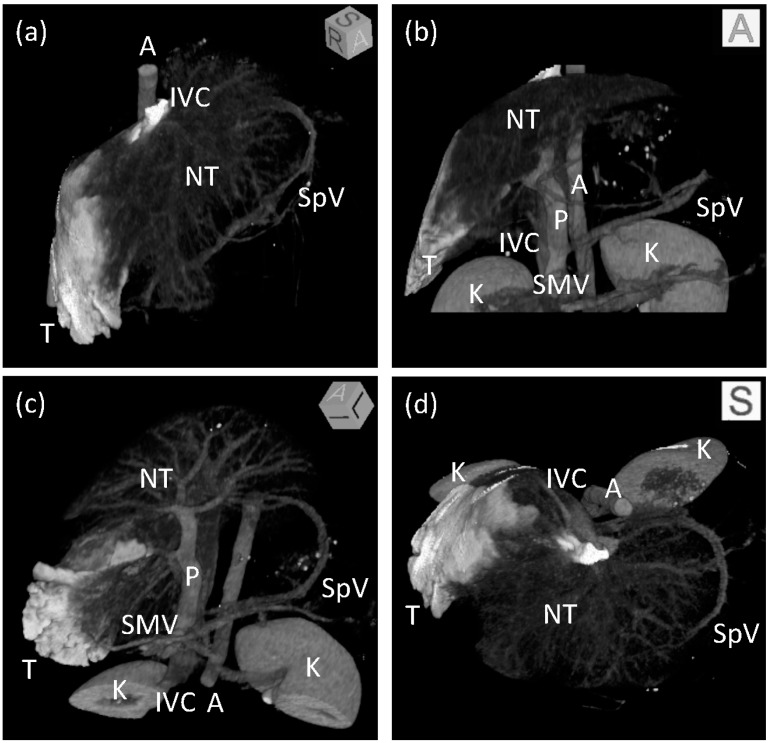
Figure 4.
Three-dimensional images of the liver after regional hydrodynamic injection. Maximum intensity projection images after volume rendering viewing from the (a) right anterior superior, (b) anterior, (c) left anterior inferior, and (d) superior directions. The target area is shown in white. Branches of the hepatic and portal vein are visible in the non-target area of the liver. Boxes at the upper right corner of each image show an angle of 3D images. T: target area; NT: non-target area; IVC: inferior vena cava; P: portal vein; SpV: splenic vein; SMV: superior mesenteric vein; A: aorta, K: kidney.

