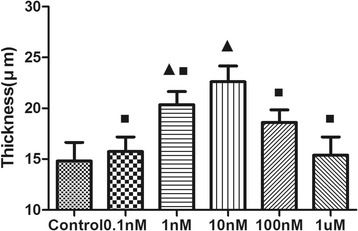
Fig. 4.

Comparison of biofilm thickness under different concentrations of AI-2. Data represent the average of three image stacks collected from randomly selected areas. Triangles denote a statistically significant difference from the control (P < 0.05). Squares denote a statistically significant difference from the 10nM AI-2 group (P < 0.05)
