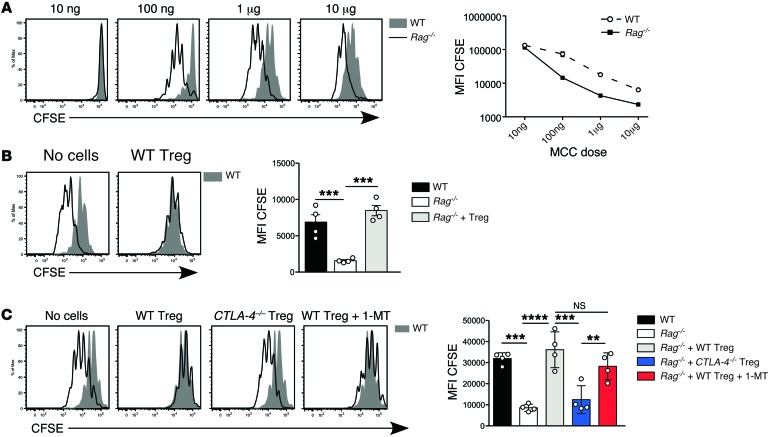
Figure 5. Effect of Treg reconstitution on naive T cell responses to specific antigen.
(A) 1 × 10⁶ 5C.C7 TCR tg Rag–/– T cells were adoptively transferred into WT or Rag–/– mice, together with i.v. MCC peptide at the indicated doses. Left panel: Representative CFSE division profiles from the pLN at day 3 after transfer in WT (filled histograms) and Rag–/– hosts (unfilled histograms) (n = 3 per group). Right panel: CFSE MFI on donor 5C.C7 T cells plotted against MCC dose in WT (broken line) and Rag–/– hosts (unbroken line). Results are representative of 3 independent experiments. (B) 5C.C7 T cell proliferation in response to 1 μg i.v. peptide in Rag–/– hosts reconstituted with 2.5 × 10⁶ WT Tregs. Left panel: Representative day 3 CFSE division profiles in pLN of Treg-reconstituted Rag–/– hosts (unfilled histograms) and WT controls (filled histograms) (n = 4 per group). Right panel: CFSE MFI on 5C.C7 T cells. Data are representative of 3 independent experiments. (C) 1 × 10⁶ CFSE-labeled 5C.C7 T cells were transferred into Rag–/– hosts reconstituted with WT or CTLA-4–deficient Tregs (n = 4 per group). As described in Figure 4, one group of WT Treg-reconstituted mice was treated with 1-MT. MCC peptide (1 μg) was administered i.v. at the time of T cell transfer. Left panel: CFSE division profiles in pLN at day 3 after T cell transfer (unfilled histograms) and untreated WT controls (filled histogram). Right panel: CFSE MFI on 5C.C7 T cells. Data are from 1 of 2 independent experiments for comparison of WT and CTLA-4–deficient Tregs, and a single experiment for 1-MT treatment. Statistical analysis of B and C was performed using one-way ANOVA with a Newman-Keuls post-test. Bars represent mean ± SEM with individual values indicated by the open circles. **P < 0.01, ***P < 0.001, ****P < 0.0001.

