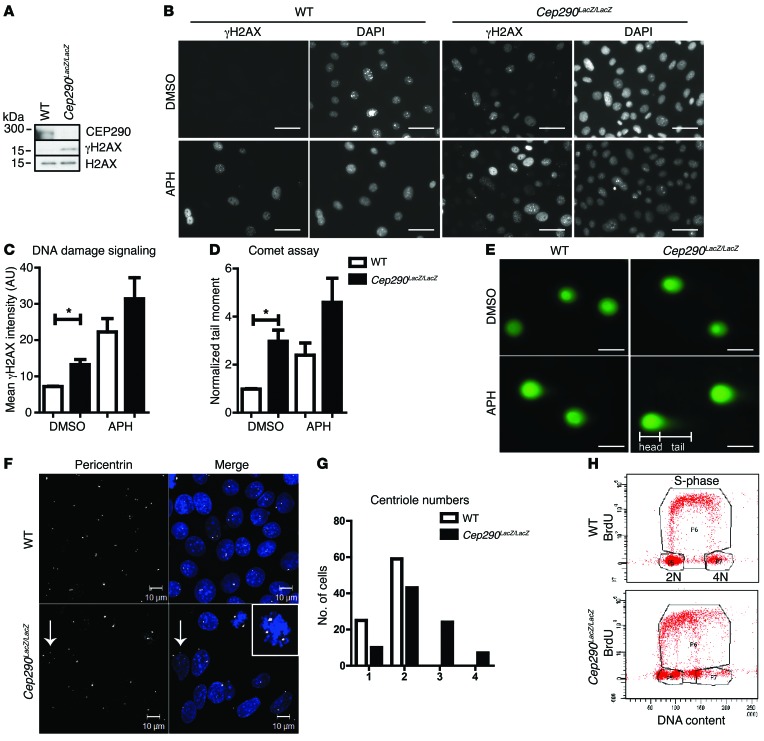
Figure 2. DNA damage is enhanced in CEP290-depleted cells.
(A) Western blot of Cep290LacZ/LacZ and WT primary mouse kidney cell lysates. Increased H2AX phosphorylation was detected in the CEP290-depleted cells. H2AX was used as loading control. (B) Immunofluorescent staining of γH2AX in control cells treated with DMSO and in cells treated with 400 nM APH for 18 hours. Scale bar: 10 μm. (C) Quantification of γH2AX staining intensity per nucleus in control cells treated with DMSO and in cells treated with 400 nM APH for 18 hours (n = 3; 100 cells scored per condition; 2-way ANOVA, *P < 0.05). (D) Quantification of comet tail moments of cells treated with 400 nM APH for 18 hours normalized to control DMSO-treated WT cells (n = 3; 50 cells scored per condition; 2-way ANOVA, *P < 0.05). (E) Images of SYBR Gold–stained DNA in comet tail assays. Scale bar: 10 μm. (F) Immunofluorescent staining of WT and Cep290LacZ/LacZ cells for pericentrin (white) reveals supernumerary centrioles (arrows) in Cep290LacZ/LacZ cells. The inset shows multipolar (>2) spindles. Scale bars: 10 μm; original magnification ×2 (inset). (G) Quantification of centriole number in WT and Cep290LacZ/LacZ cells (84 cells scored per cell line; n = 3). (H) BrdU FACS of WT and Cep290LacZ/LacZ cells shows normal DNA content and cell cycle for WT cells; however, Cep290LacZ/LacZ cells have irregular DNA content (10,000 events measured; n = 3).

