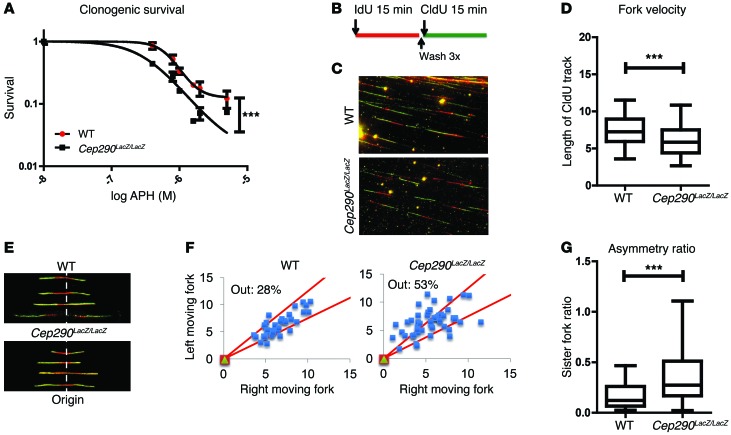
Figure 3. Loss of CEP290 leads to replication stress.
(A) Clonogenic survival of control cells treated with DMSO and of cells treated with 500 to 5000 nM APH for 18 hours, showing sensitivity to replication stress of Cep290LacZ/LacZ cells. Log IC50 curves are compared with nonlinear regression (curve fit; n = 3; ***P < 0.001). (B) Schematic overview of pulse labeling of cells with IdU and CldU for 15 minutes. (C) Immunofluorescent staining of DNA fibers after pulse labeling with IdU (red) and CldU (green), respectively. Original magnification, x40. (D) Quantification of replication fork velocity by measuring length of the CldU track. Cep290LacZ/LacZ cells demonstrate decreased fork velocity (700 tracks scored per condition; n = 4; t test, ***P < 0.001). Horizontal bars indicate the median values, boxes indicate 25th to 75th percentiles, and whiskers indicate 5th and 95 percentiles. (E) Immunofluorescent staining of DNA fibers after pulse labeling with IdU (red) and CldU (green), respectively. Asymmetric replication at origins in Cep290LacZ/LacZ cells is present. Original magnification, x40. (F) Quantification of fork asymmetry at origins in Cep290LacZ/LacZ cells. When the replication track differs more than 25% between the right and left moving fork, the measurement falls below the cutoff (50 tracks scored per condition). (G) Fork asymmetry ratio, as calculated by the ratio of the right and left moving forks (50 tracks scored per condition; n = 2; t test, ***P < 0.001). Horizontal bars indicate the median values, boxes indicate 25th to 75th percentiles, and whiskers indicate 5th and 95 percentiles.

