Figure 2.

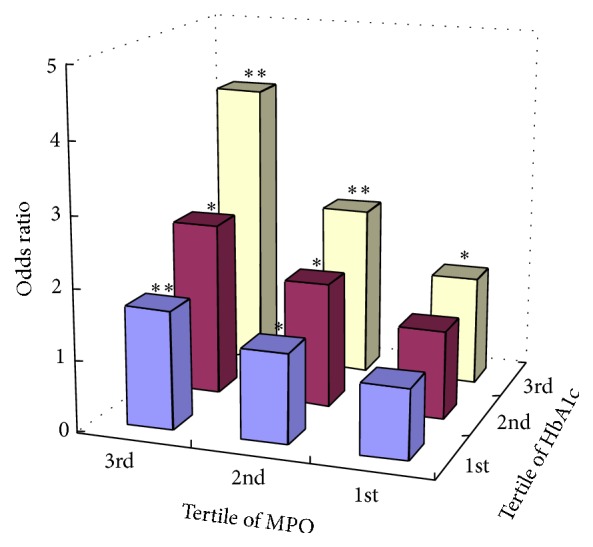
Odds ratio for CAD associated with tertiles of plasma MPO level and tertiles of HbA1c level compared to the group with 1st MPO tertile and 1st HbA1c tertile. ∗ p < 0.05, ∗∗ p < 0.01.

Odds ratio for CAD associated with tertiles of plasma MPO level and tertiles of HbA1c level compared to the group with 1st MPO tertile and 1st HbA1c tertile. ∗ p < 0.05, ∗∗ p < 0.01.