
Figure 11.
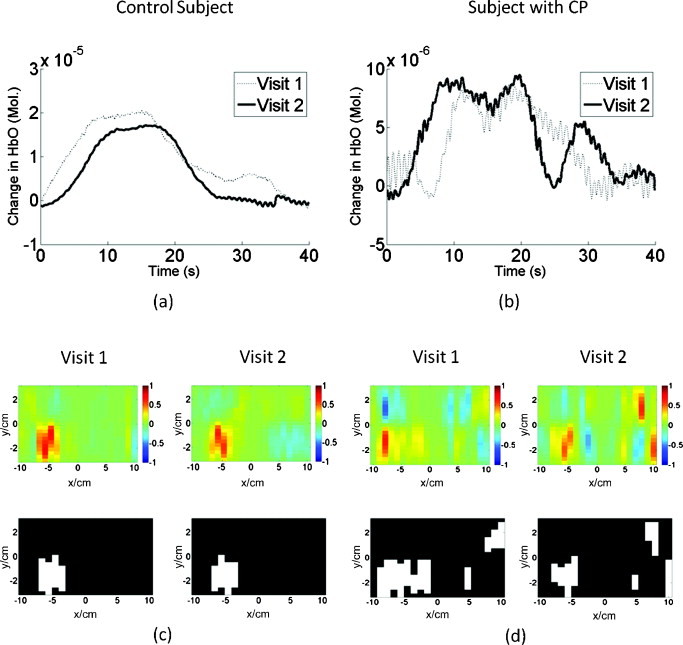
Repeated fNIRS measurements for a control (Subject 2) and a subject with CP (Subject 8) performing right finger tapping: (a,b) show the time-series reflectance patterns for the same source-detector pair, while (c,d) show the activation images (top) and their corresponding activation-threshold images (bottom) for each visit.