
Figure 2.
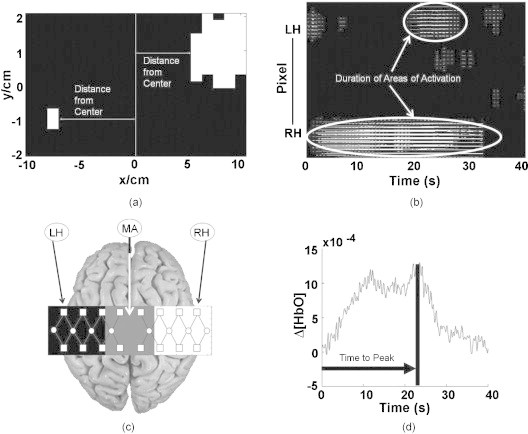
Pictorial descriptions of the spatial and temporal image metrics: (a) Measurement of distance from center for both hemispheres. (b) Duration was computed as the average temporal length of activation (white areas) per pixel. The pixels were concatenated from the LH to the RH. (c) The area difference metric measured as the difference in activation area between the middle area (MA) and the contralateral hemisphere to the tapping hand (i.e., RH for left finger tapping or LH for right finger tapping). (d) Time-to-peak measurement in which the arrow represents the time that the signal took to reach its peak from the beginning of the tapping interval.