Figure 3.

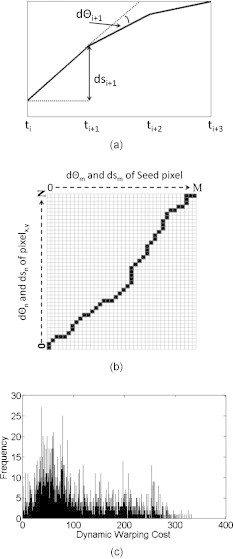
(a) Measurements made for the change in angle defined by the tangent and the change in amplitude for every time point, (b) illustration of a DTW path, and (c) histogram of the dynamic warping costs for all control subjects.

(a) Measurements made for the change in angle defined by the tangent and the change in amplitude for every time point, (b) illustration of a DTW path, and (c) histogram of the dynamic warping costs for all control subjects.