
Figure 8.
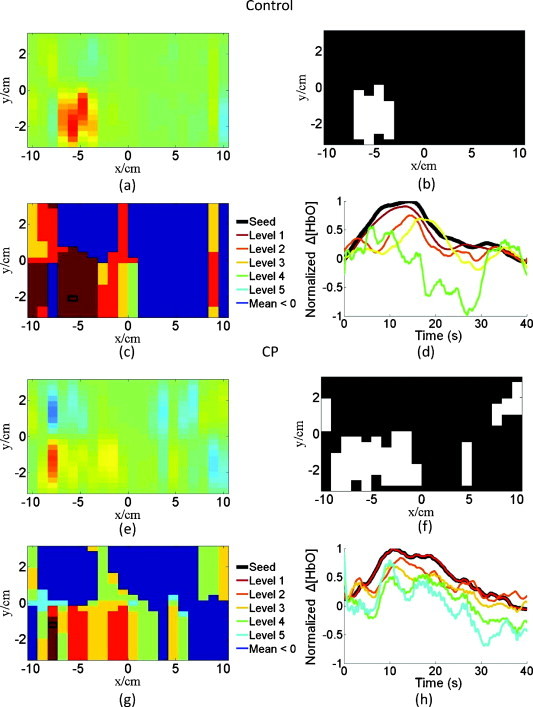
Images shown are for a control subject, Subject 2, in which the (a) normalized image of the average change in HbO concentration, (b) the thresholded activation image, (c) the similarity image with color-coordinated levels, and (d) the corresponding average temporal responses for the color-coordinated similarity levels are shown. Not all five levels of similarity are seen for this control subject. The images at the bottom are for a subject with CP, Subject 7, in which (e–h) correspond to (a–d) for the control subject.