
Fig. 5.
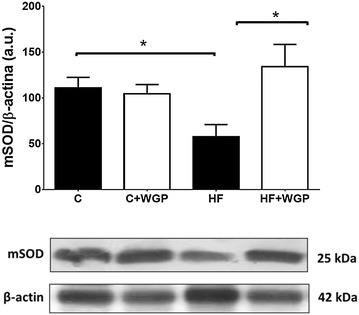
WGP prevents the reduction in renal mSOD protein levels. Protein extracts from kidneys from control (C), control + WGP (C + WGP) high fructose (HF) and high fructose + WGP (HF + WGP) fed animals were used to evaluate mSOD protein levels. Bars represent mean ± SEM for n = 4 animals in each group. Bars represent mean ± SEM for n = 4, *p < 0.05 HF vs. other groups. Bonferroni after one way ANOVA. Representative blots for mSOD and β-actin used as loading control are shown under the graph