
Figure 2. Functional connectivity was significantly altered between the default mode subnetworks and other intrinsic connectivity networks in schizophrenic patients relative to healthy controls (two-sample t-test, P < 0.05, FDR corrected).
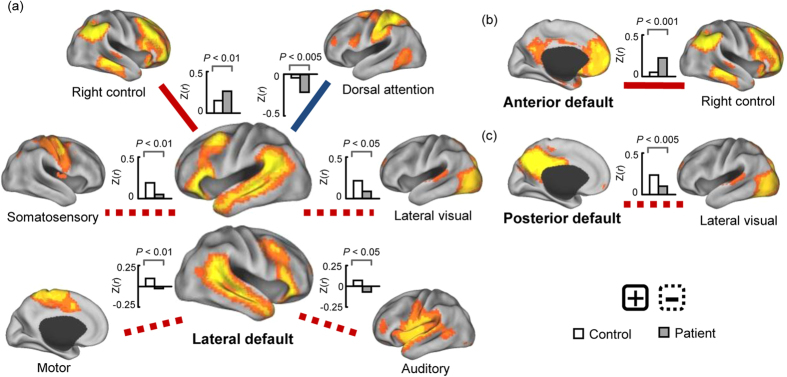
The connections, as shown, were also significantly altered in non-medicated patients (n = 34) relative to healthy controls (two-sample t-test, P < 0.05, uncorrected). The red and blue lines represent positive and negative functional connectivity, respectively. The solid and dashed lines represent an increase and decrease in schizophrenic patients relative to healthy controls, respectively. CARET software (CARET; http://brainvis.wustl.edu) was used for surface rendering.