
Figure 1. Circulating trends of RSV in Ontario, Canada.
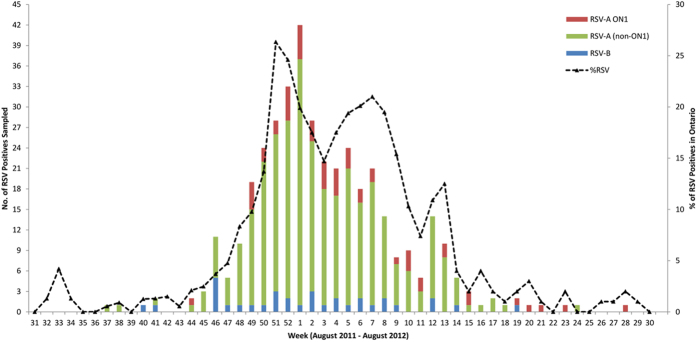
The weekly distribution of RSV-A and -B among the randomly selected sample set (columns) and the percent positivity of RSV-A and -B among all respiratory specimens tested at Public Health Ontario (dotted lines). Percent positivity data obtained from the Public Health Ontario Laboratory-based Respiratory Pathogen Surveillance Report: week 51–52 (December 18–31, 2012) and week 30–31 (July 22-August 4, 2012)60.