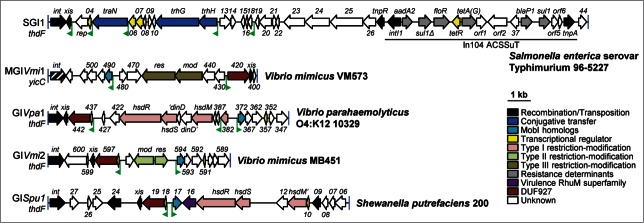
Figure 3.
AcaCD-activated GIs. Schematic representation of the genetic map of GIs bearing predicted AcaCD binding sites. GIs are drawn to scale. The position and orientation of the predicted AcaCD boxes are shown by green flags. Gene numbers correspond to the last digits of respective locus tags in Genbank accession numbers AF261825 (SGI1), NZ_ACYV01000005 (MGIVmi1), AFBW01000022 (GIVpa1), ADAF01000001 (GIVmi2), CP002457 (GISpu1). The insertion site of the GIs is indicated below GI names. A, ampicillin; C, chloramphenicol; S, streptomycin; Su, sulfamethoxazole; T, tetracycline. The integrase (int) gene of MGIVmi1, which belong to a different family of int genes compared to other GIs represented in the figure, is shown by a black hatched arrow.

