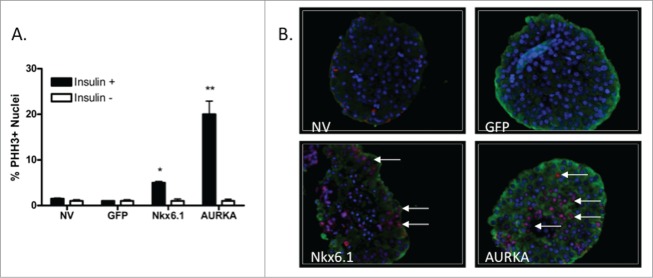
Figure 5.

Overexpression of AURKA enhances mitotic phase progression. (A) Percentage of PHH3+Insulin + islet cells after culture for 96 h after adenoviral transduction. (B) Representative images (40x magnification) of islets stained for PHH3. Arrows indicate PHH3+Insulin+ nuclei. DAPI is blue, Insulin is green, PHH3 is red. Data represent the mean±SEM of 4 independent experiments. *P ≤ 0.05; **P ≤ 0.01. P value represents the comparison between AURKA- and GFP-treated islets.
