Figure 3.
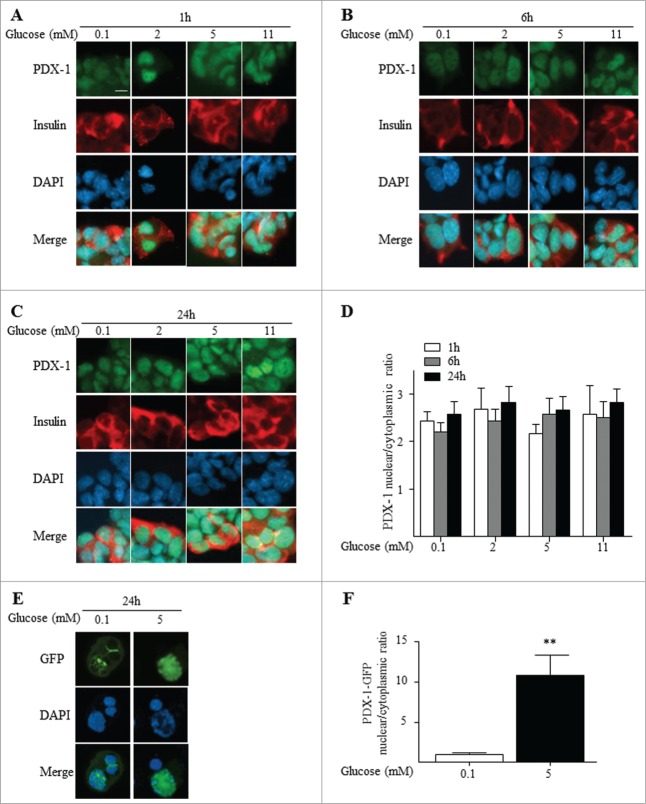
In HIT-T15 cells, endogenous PDX-1 is localized to the nucleus independent of the glucose concentration, whereas ectopically expressed PDX-1 shuttles from the cytoplasm to the nucleus in a glucose-dependent manner. PDX-1 (green), insulin (red) and nuclei (DAPI, blue) were visualized by fluorescence microscopy (×20). HIT-T15 cells were exposed 1 h (A), 6 h (B) and 24 h (C) to increasing glucose concentrations as indicated. (D) Quantification of nuclear/cytoplasmic ratio of 3 replicate experiments. Results are expressed as mean ± SEM. (E) HIT-T15 cells were transfected with pcDNA3.1-PDX-1-GFP plasmid and exposed for 24 h to 0.1 or 5 mM glucose. PDX-1 (GFP, green) and nuclei (DAPI, blue) were visualized by confocal microscopy. (F) Quantification of nuclear/cytoplasmic ratio of 3 replicate experiments. Results are expressed as mean ± SEM. **P ≤ 0.01. Scale bar, 10 μm.

