
Figure 3.
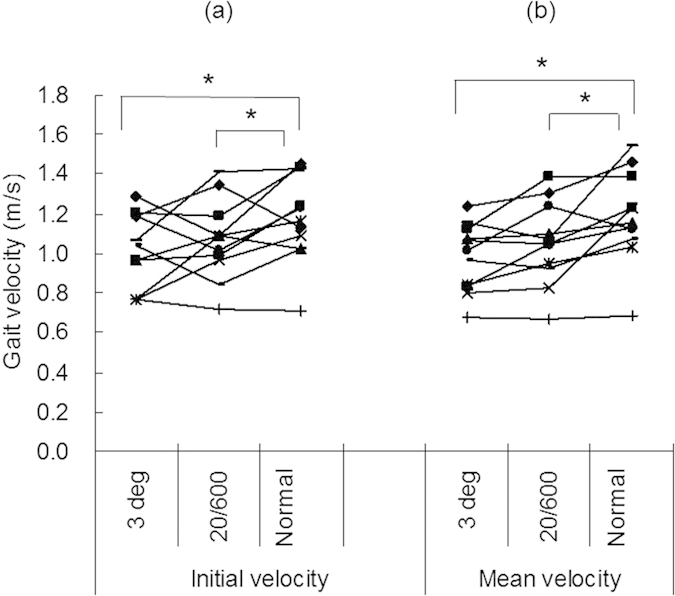
(a) Initial velocity (mean velocity during the first 0.1 s of the first step) and (b) mean velocity in subjects in whom low visual function was simulated by reducing visual acuity to 20/600 and counting fingers, and reducing the visual field to 3°. Note that gait velocity was correlated with visual function. There was a significant difference between values obtained under normal vision conditions (visual acuity > 20/15) and each simulated low-vision condition (*P < 0.05, paired t-test).