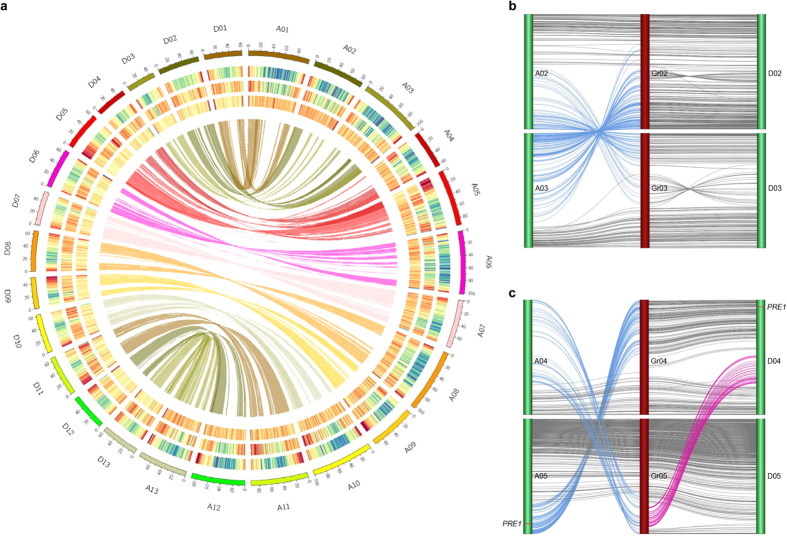
Figure 2. G. barbadense genome atlas and chromosome-level translocations.
(a) Genome atlas. The outermost circle represents the numbered chromosomes of At and Dt, and chromosome sizes are marked by a scale plate. The three tracks moving inside successively represent gene, peudogene and repeat densities (calculated with 1 Mb windows) across the chromosomes. The core ribbon-link shows collinearity between At and Dt. (b,c) chromosomal translocations. The translocations among chromosome 2 and chromosome 3 of either At or Dt are indicated with blue lines (b) and those among chromosome 4 and chromosome 5 with blue and purple lines (c). The vertical colored lines from left to right represent chromosomes. The loci of PRE1 implicated in fiber cell elongation are specifically marked with red in the chromosomes A05 and D04. Digits (01 to 13) after A, D or Gr indicate the chromosome of the At/Dt subgenome of G. barbadense or of G. raimondii, respectively.

