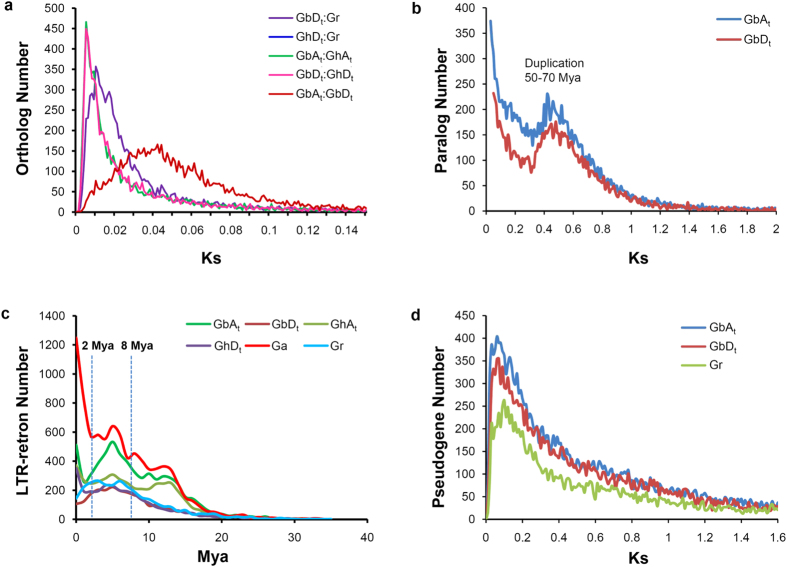
Figure 3. Evolutionary analysis of the G. barbadense genome.
(a) Ks distribution of orthologs in cotton genomes. Data are grouped into 0.001 Ks units. (b) Ks distribution of paralogs in the G. barbadense genome. Data are grouped into 0.01 Ks units, and the peak region corresponds to 50–70 million years. (c) The distribution curve of the insertion times in the LTR retrons in the G. barbadense genome. The LTR retrons bursts are separated by dashed lines. (d) Ks distribution of pseudogenes with their closest functional paralogous genes. Data are grouped into 0.001-Ks units. The genomes of allotetraploid cottons are labeled using At/Dt, and the genomes of G. arboreum (A2) and G. raimondii (D5) are labeled using Ga and Gr.

