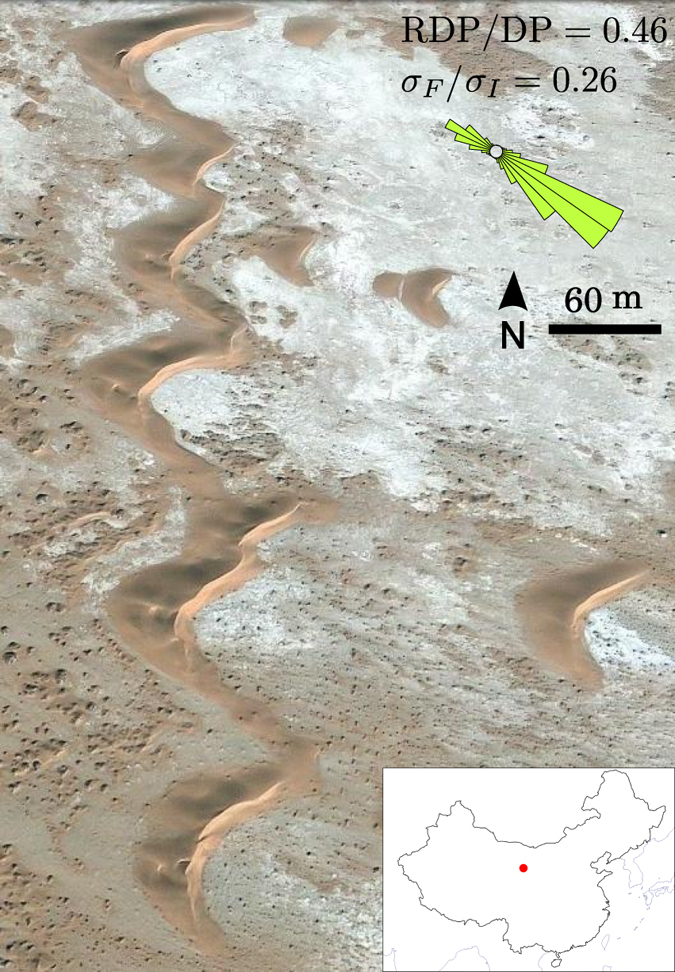
Figure 7. Barchan dunes in a zone of low RDP/DP and σF/σI-values.

These dunes are located in a sand corridor between the Badain Jaran and the Tengger deserts (China, 39°23′25′′ N, 102°59′26′′ E, image credit: Google Earth). Inset shows the local sand flux roses. In this area, the mean RDP/DP-value and the flux roses derived from the ERA-Interim data are in agreement with the direct measurements of Zhang et al.38, ten kilometers away from the dunes. The map used in this figure is generated by GMT (The general mapping tools).
