
Figure 2. Anatomical correlates of SRE.
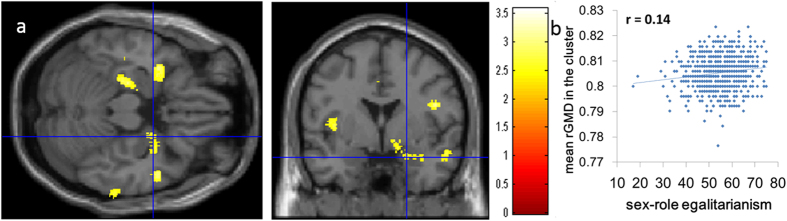
(a) Regions showing a significant correlation are overlaid on a “single-subject” T1-weighted structural image of SPM5. The red color represents the T score for the positive correlation between rGMD and the SESRA-S score. rGMD was positively correlated with individual SRE in an area of the right amygdala. A similar tendency was seen in the corresponding area in the left hemisphere. Results are shown with P < 0.01, uncorrected, and are for visualization only. (b) A scatter plot between the SESRA-S score and the mean rGMD value in the significant cluster in (a) has been shown for visualization only.