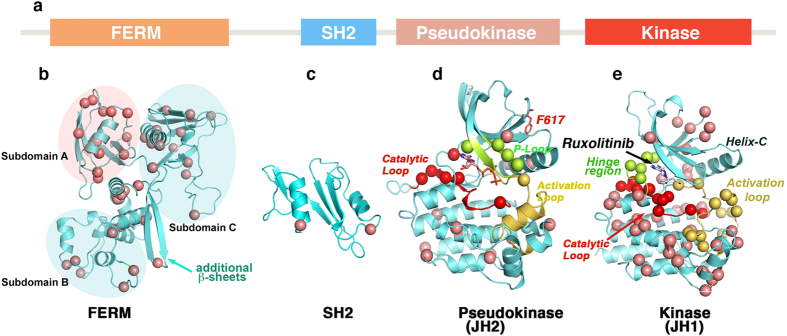
Figure 2. Mapping of ruxolitinib-resistant mutations on JAK2 structure.

(a) Primary structure of JAK2 kinase showing structural subdomains. (b) FERM domain model, developed by homology modeling using FAK coordinates (PDB: 2J0J and 2J0L), showing different subdomains and distribution of resistant variants. Subdomains A and C have the highest number of mutations. In contrast to FERM domain of FAK, we identified two extra β-sheets in JAK2 between subdomains B and C (cyan arrow). (c) Homology model of the SH2 domain based on SRC and ABL structures (1OPK and 2SRC), showing resistant mutations in the α-helices. (d) Pseudokinase structure (PDB: 4FVR) showing the oncogenic mutation V617F (green) and many resistant variants clustered in the catalytic site—around the ATP-binding site (red), P-loop (green), and helix-C (pink) (e). JAK2 kinase domain structure (PDB: 2B7A) docked with ruxolitinib showing the distribution of resistant mutations. Many mutations are clustered around the ATP binding and catalytic sites, and in the C-lobe. The catalytic site is comprised of a catalytic loop (red), hinge region (green) and activation loop (yellow). α-C of mutant residues are presented as circles.
