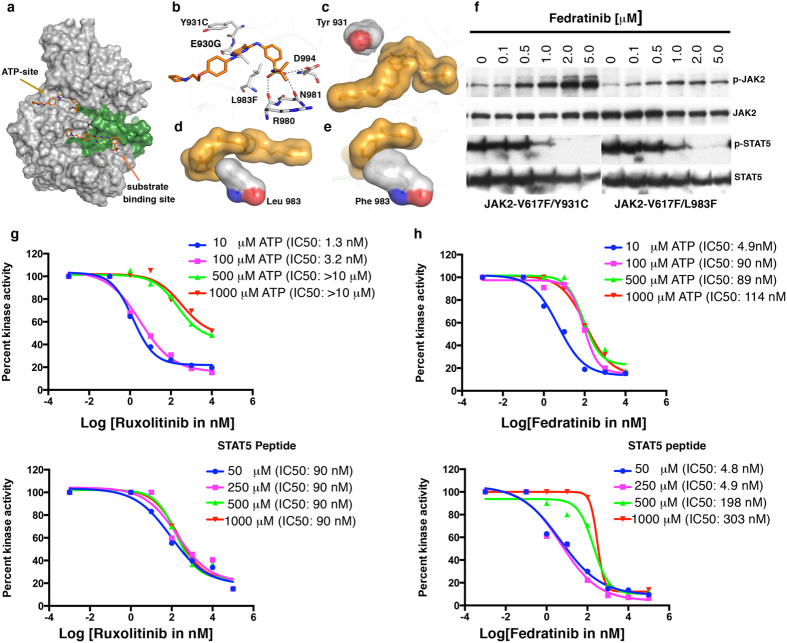
Figure 5. Fedratinib binds to ATP and substrate-binding sites in JAK2 kinase.
(a) Surface depiction of JAK2 kinase in active conformation, showing activation loop (green), fedratinib binding (orange stick) to ATP-binding and substrate-binding sites (arrows). (b) Enlarged view of ATP-binding site, showing fedratinib anchorage by hydrogen bonding (dashed gray line) with Glu 930 (hinge region), Arg 980 and Asn 981 (catalytic site), and Asp 994 of the DFG motif. (c) Surface depiction of Tyr 931showing no direct interaction with fedratinib. However, resistant variant Y931C confers moderate resistance, possibly by modulating the architecture of the active site as a result of loss of hydrogen bonding with water molecules (Fig. 2a). (d) Surface depiction of Leu 983 from catalytic site. (e) Effect of phenylalanine substitution for Leu 983 on fedratinib binding and resistance. (f) Immunoblot analysis of BaF3 cells expressing JAK2-V617 variants Y931C and L983F, showing dose-dependent inhibition by fedratinib. Upper and lower panels show increasing phospho-JAK2 and decreasing phospho-STAT5, respectively, with increasing drug concentrations. Blots were stripped and reprobed for total JAK2 and STAT5 levels. (g) Steady-state kinetic analysis of purified JAK2 kinase inhibition by INCB01842 with increasing ATP concentrations (upper panel) and STAT5 peptide-substrate concentrations (lower panel). IC50 values for kinase inhibition are shown in parentheses against each concentration. (h) Purified JAK2 kinase inhibition by fedratinib, showing a ~20-fold change in IC50 value (upper panel) with increasing ATP concentration. Similarly, increasing substrate concentrations (lower panel) showed an even higher shift in IC50 value (~60 fold).

