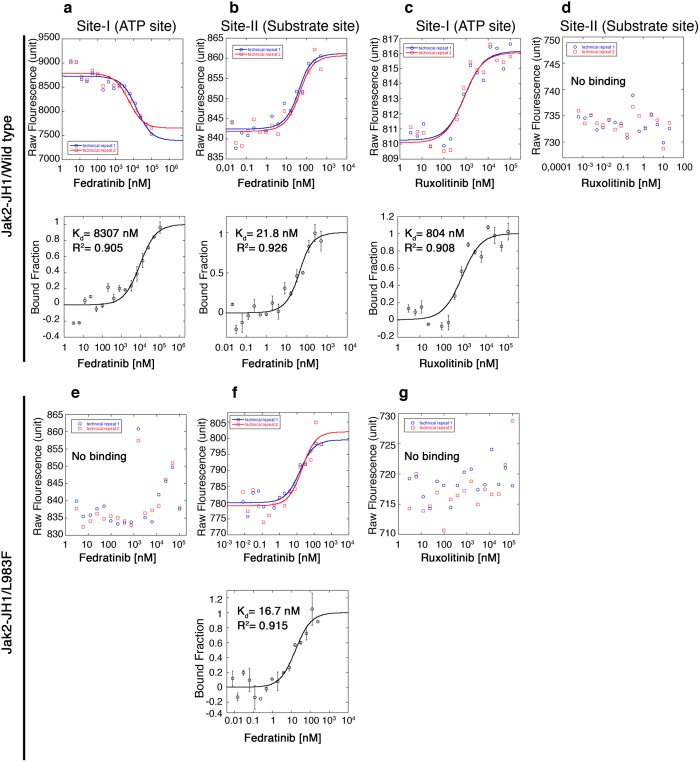
Figure 7. Fedratinib binds to substrate-site with higher affinity than ATP site.
(a,b) Microscale thermophoresis (MST) analysis showing the dual binding of fedratinib to JAK2-WT. Top panels are showing the fluorescence. Bottom panels are showing the bound fractions of inhibitors and proteins to calculate the dissociation constant (Kd), which is mentioned in the parenthesis. Fedratinib binding was carried out with label free proteins. (c,d) MST analysis shows a single binding site (Site I-ATP site) for ruxolitinib with JAK2-WT. Top panels are showing the fluorescence. Bottom panels are showing the bound fractions of inhibitors and proteins to calculate the dissociation constant (Kd), which is mentioned in the parenthesis. Because, ruxolitinib showed auto-fluorescence that precluded label free binding analysis, we performed ruxolitinib binding with fluorescently labeled proteins. Note, we could not detect any secondary binding site for ruxolitinib. (e,f) MST analysis with JAK2-L983F showed only one binding site for fedratinib at site –II (substrate site). A phenylalanine substitution for Leu 983 causes steric hindrance to fedratinib and it no longer can bind to site-I, ATP site. In contrast, substrate site is not affected by this mutation and therefore binding of fedratinib to site-II is not affected showing similar kd values. Top panels are showing the fluorescence. Bottom panels are showing the bound fractions of inhibitors and proteins to calculate the dissociation constant (Kd), which is mentioned in the parenthesis. (g) MST analysis with JAK2-L983F showing loss of ruxolitinib binding with mutant L983F. These experiments were performed twice in duplicates.

