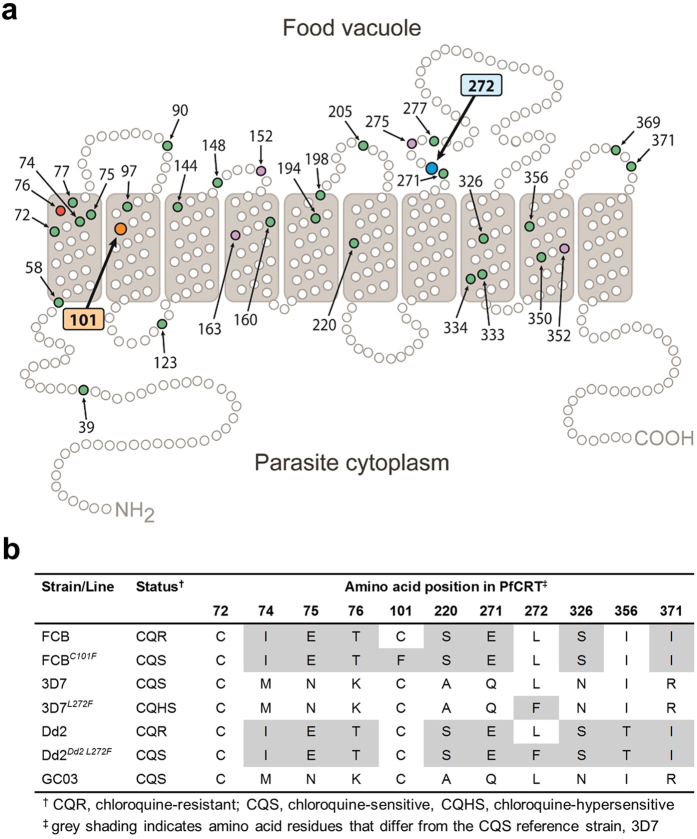
Figure 1. PfCRT mutations.
(a) Schematic representation of PfCRT and positions of previously identified polymorphisms8,71 from field isolates (green circles) and from drug-pressured laboratory lines (purple circles). The critical CQ resistance mutation site (K76) is shaded red, and the two residues at which mutations are described in this study are shaded in orange (C101) and blue (L272). (b) PfCRT haplotypes included this study.

