
Figure 2. Graphic output of the CpGassoc method, showing the Manhattan plot for the association between methylation and AGA-LGA group.
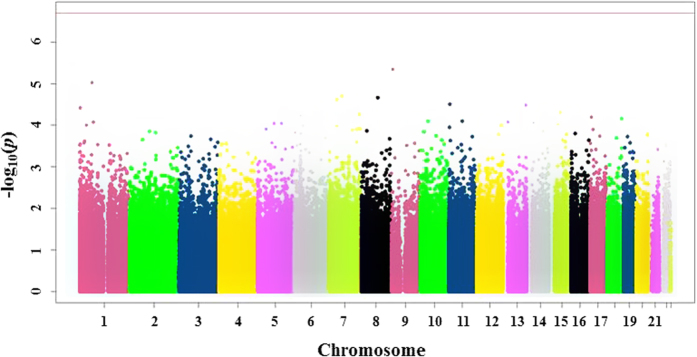
X-axis: location of CpG site in the genome by chromosome; y-axis: -log10 of the p-value for each CpG site (dots), with more negative values indicating greater differences between groups. The red horizontal line at the top of the figure represents the cutoff for FDR-adjusted p < 0.05; the absence of dots above this line shows that no statistically significant differences were observed.