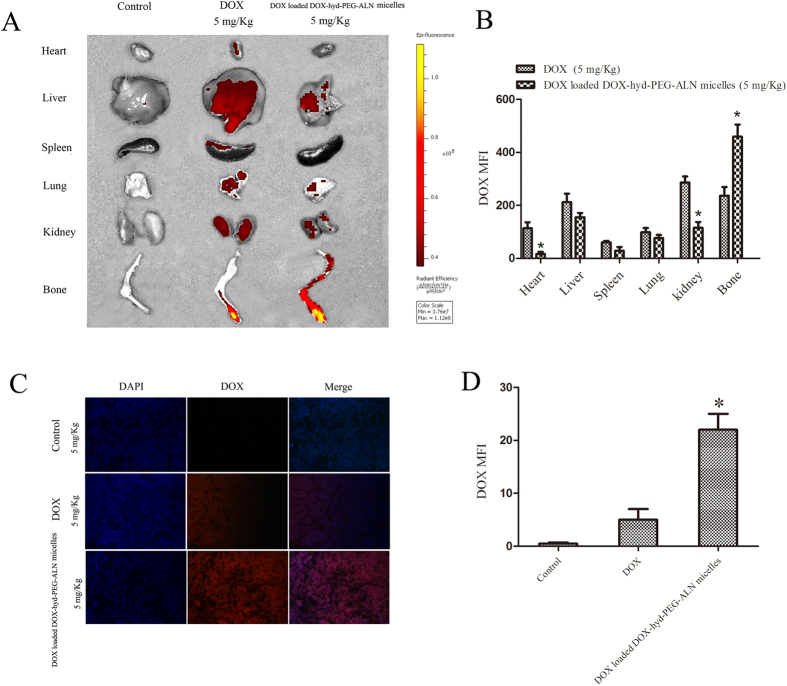
Figure 11.
Tissue distribution of DOX detected by living image system (A) and distribution of DOX in the tumor tissue section detected by CLSM (C) at 24 h after free DOX (5 mg/kg) and DOX loaded DOX-hyd-PEG-ALN micelles (equivalent dose of DOX: 5 mg/kg) was intravenously administered to tumor-bearing nude mice. Quantitative analysis of in-Vivo Images (B, *P < 0.05 vs DOX in the same organ tissue) and CLSM images (D, *P < 0.05 vs DOX). Data are presented as the average ± standard deviation.

