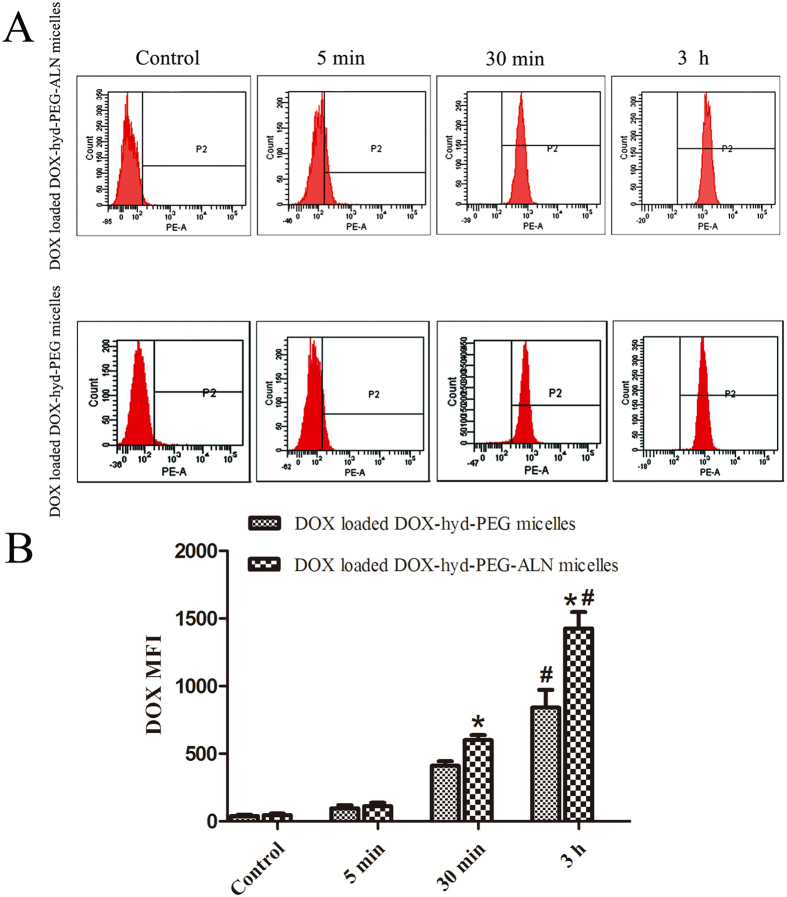
Figure 8.
Flow cytometry images (A) of A549 cells incubated with DOX loaded DOX-hyd-PEG-ALN micelle and DOX loaded DOX-hyd-PEG micelle for 5 min, 30 min and 3 h at 37 °C. Quantitative analysis of flow cytometry images (B), *P < 0.05 vs DOX loaded DOX-hyd-PEG micelle at the same time point; #P < 0.05 vs 30 min of the same micelle. DOX concentration was 10 μg/mL.

