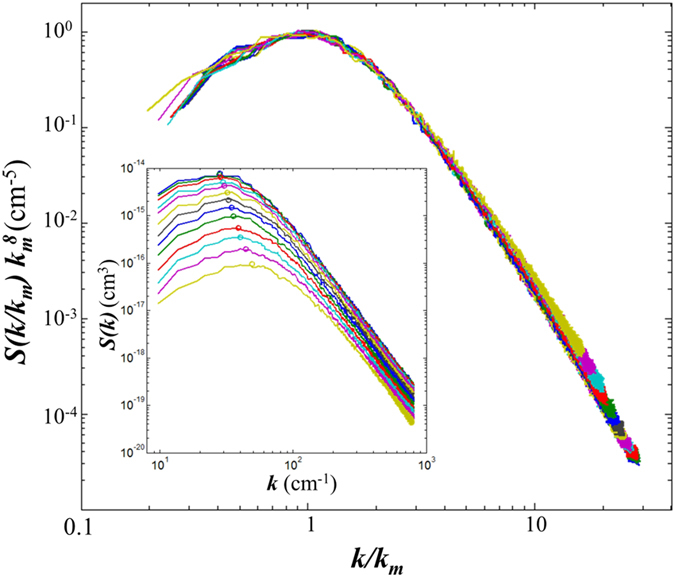
Figure 6. Dynamic scaling of the spectra of the non-equilibrium fluctuations during the approach to steady state.

The inset shows the unscaled structure factors. Times span the range  and are distributed geometrically with a multiplier of 1.21 (for a total of 13 curves).
