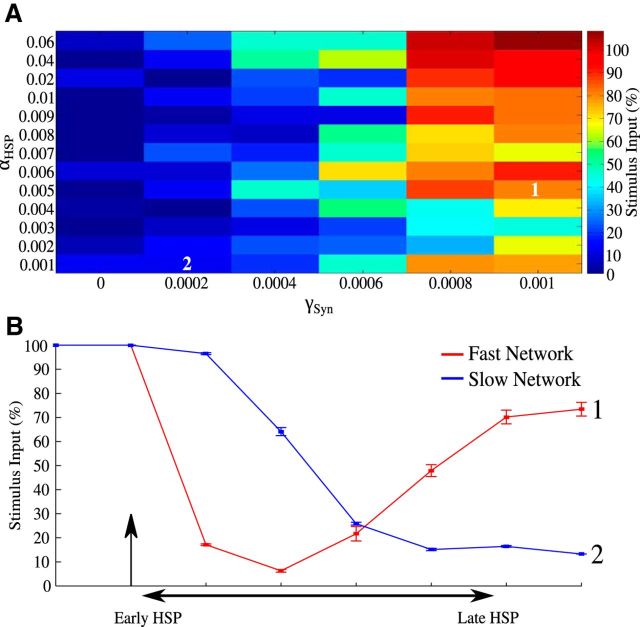
Figure 7.
Effect of axonal sprouting rate on seizure threshold. A, Seizure threshold (color map) as a function of HSP αHSP and sprouting rate, γSyn. All thresholds were tested in late HSP condition representing the last data points in B. The tiles numbered 1 and 2 correspond to the thresholds of the fast and slow networks, respectively, in B. B, Threshold dynamics (±SD) for two sample networks. A total of 50% deafferentation was applied at 100 s (arrow). The “fast” network (red) has a fast HSP and fast sprouting rate (αHSP = 0.005, γSyn = 0.001), whereas the “slow” network (blue) has slow HSP and slow sprouting rate (αHSP = 0.001, γSyn = 0.0002). A total of 100% represents seizure threshold of an intact network.

