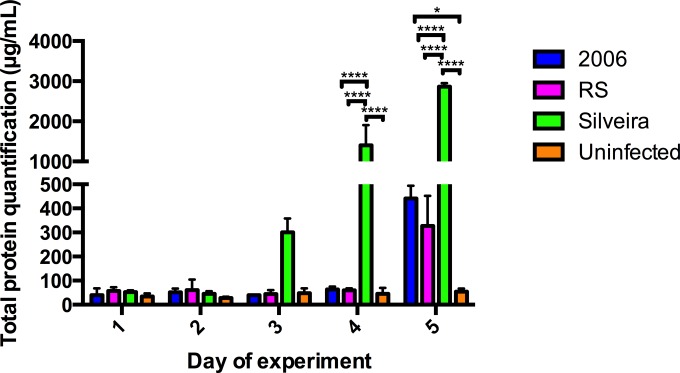
FIG 4.
Quantifying the concentration (μg/ml) of total proteins present in BALF for downstream proteomics analysis. Error bars indicate standard errors from biological replicates (n = 3 for each infection group; n = 2 for the uninfected group). P values were calculated using two-way ANOVA followed by Tukey's multiple-comparison test (*, P ≤ 0.05; ****, P ≤ 0.0001).

