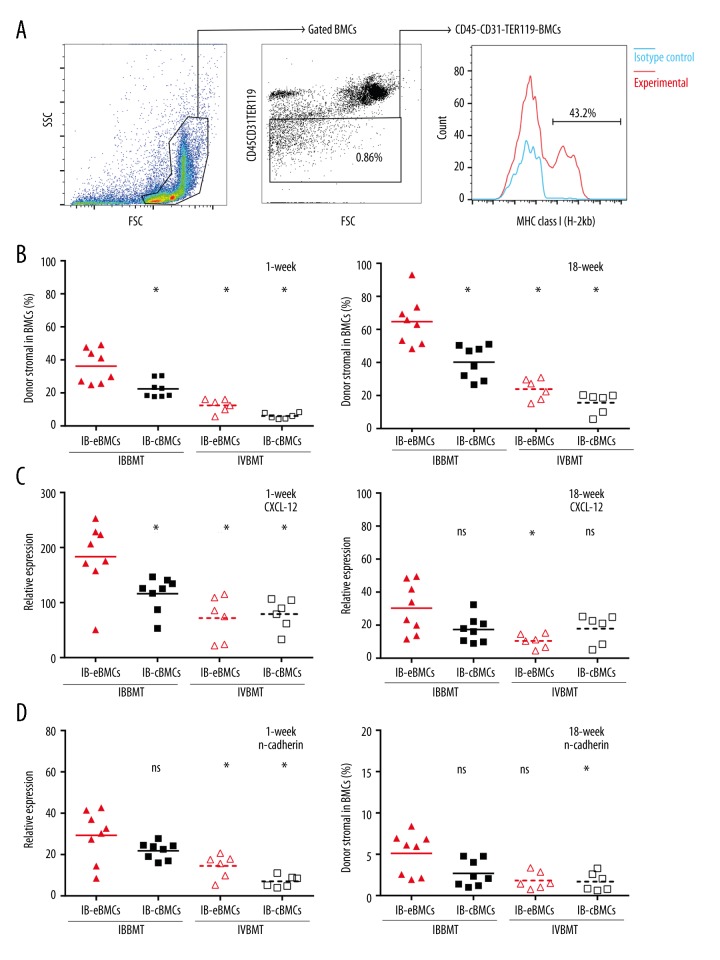
Figure 1.
The analysis of recipient stromal cell replacement and gene expressions of recipient BMCs. (A) The gating protocol for donor-derived stromal cells in recipient BMCs. FSC, Forward Scatter. SSC, Side Scatter. Blue line, isotype control. (B, C) Donor stromal percentage in recipient BMCs were assessed at 1 (B) and 18 (C) weeks after BMT. Donor stromal cell population were H-2kb+ CD45-CD31-TER119- cells in BMCs harvested from the left tibia BMs. *, p value for IB-eBMCs versus each control group, p<0.05. Each dot represents an individual mouse result and bars are the mean for each group (%), n=6 per group. (D–G) Quantitative PCR analyzes of CXCL-12 (D, E) and n-cadherin (F, G) expression of recipient BMCs were performed at 1 week (D, F) and 18 weeks (E, G) after BMT. The corresponding gene expression level of BMCs from normal untreated mice was taken as control after normalization to GAPDH. All the bars represent the mean folds increase relative to that of normal mice BMCs for each group, n=6–8 per group. *, p value of IB-eBMCs group versus each control group (IB-cBMCs, IV-eBMCs, IV-cBMCs group respectively), p<0.05. ns is for not significant.

