Figure 3.
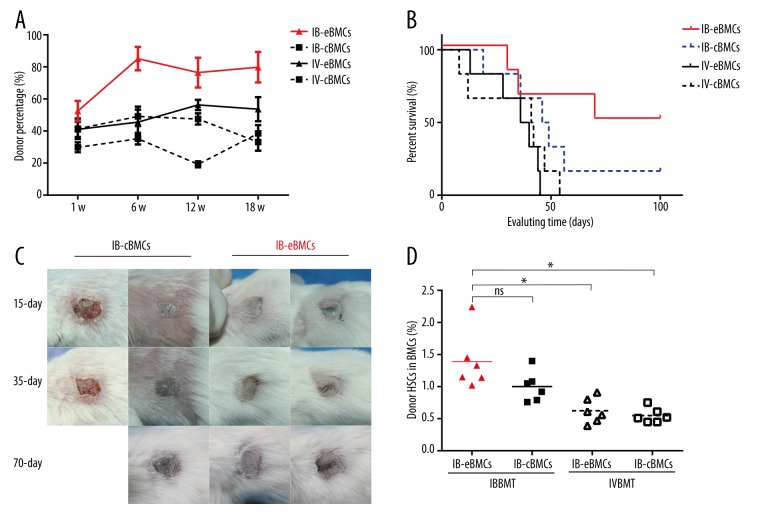
Peripheral blood mixed chimerism and skin allograft survival curve analyzes. (A) Donor-derived cell percentage in recipient PBMCs was assessed at 1, 6, 12, and 18 weeks after BMT. All the results were represented as Mean ±SD (%), n=6 for each group. (B) At 12 weeks after BMT, donor tail skin allotransplant was transplanted. Every plotted point in the diagram represented an individual skin graft rejection (n=6 per group). (C) Representative skin graft pictures of IB eBMCs group (right 2 columns) and IB-cBMCs (left 2 columns). Every column represents pictures of an individual skin graft at 15, 35, and 70 days after skin transplantation. (D) At 70 days after skin transplantation, the recipient mice were sacrificed to assess the HSCs ratio in BMCs. The data were compared between IB eBMCs group and each control group (IB-cBMCs, IV-eBMCs, IV-cBMCs group respectively) (*, p<0.05; ns for not significant). Each dot is a recipient mouse result and bars are the mean for each group, n=6 for each group.

