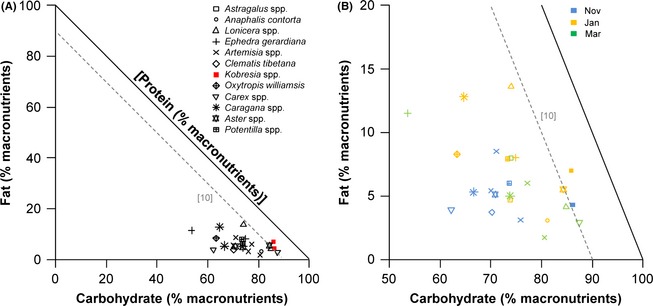
Figure 2.

(A) Right‐angled mixture triangle (Raubenheimer 2011) showing the macronutrient balance of plants consumed by blue sheep (Pseudois nayaur). Macronutrients are expressed as percentage of total macronutrients (i.e.,. protein + fat + carbohydrate). Protein is shown on the implicit z‐axis, the value of which is inversely related with distance from the origin. A dashed gray line indicating 10% protein is shown for reference. The plant genus found most frequently in the diet of blue sheep (Kobresia spp.) is shown as a red symbol; (B) A close‐up of the region of nutrient space occupied by plants consumed by blue sheep [legend provided in panel (A)]. Macronutrient estimates are color‐coded to match the month in which the sample was collected. All data points represent a single sample.
